
The System
 The Carnegie Observatories’ VizLab immersive visualization half-pipe was installed in 2020. The 45 mega pixel display powered by 4 NVIDIA Quadro P6000 GPUs system was created specifically to support the novel exploration of theoretical and observational data sets in a highly collaborative immersive digital workspace.
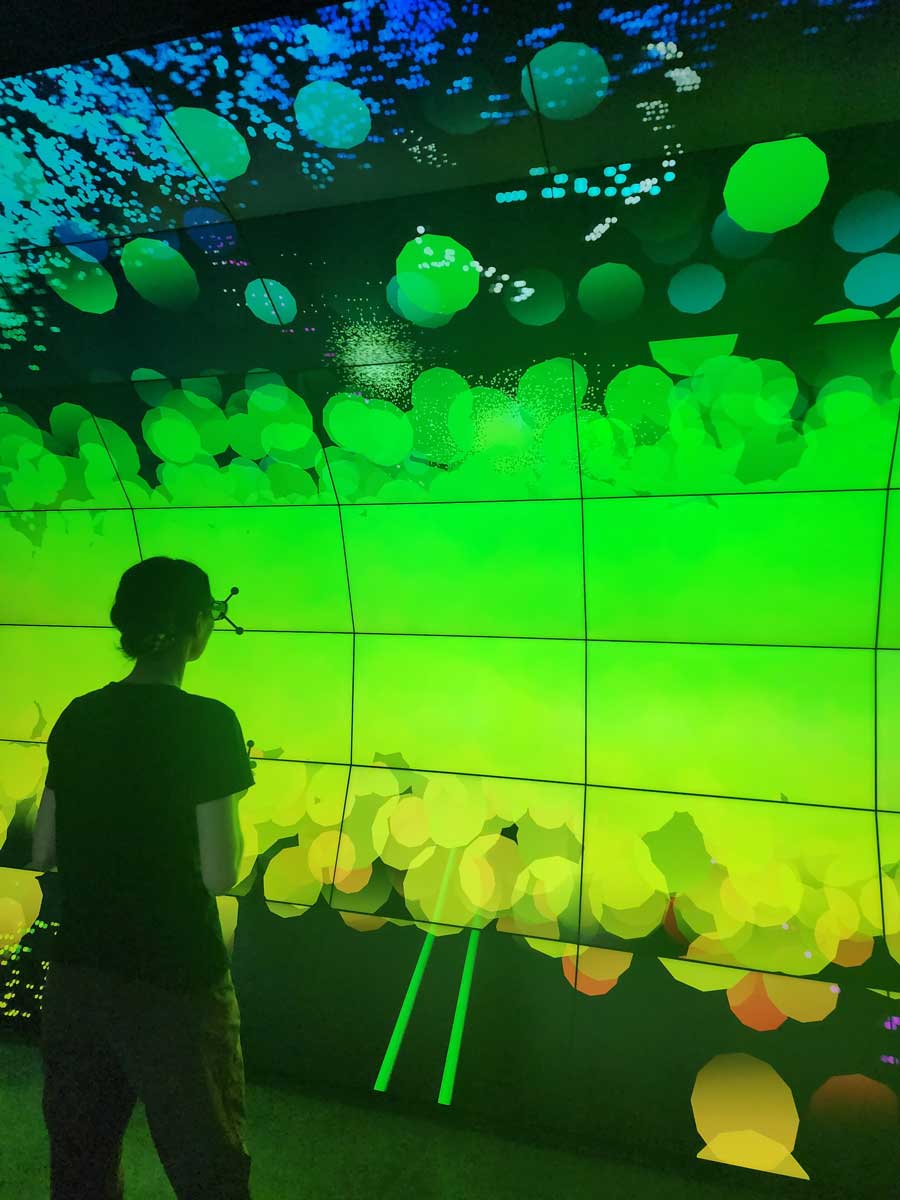
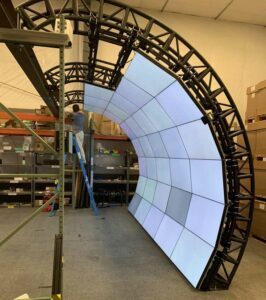
The system towers over the user standing at 12’ tall and 17’wide, immersing them in a 162-degree curve. 35 specialized LCD panels, the vibrant display is both 2D and 3D capable. Four motion tracking cameras capture the controller actions and user perspective for agile data analysis, with up to 24 viewers able to see the data as the primary user would.
The custom structure, specified graphics, and control system was designed and integrated by Mechdyne’s Solutions Engineering Team. With data sets large enough to hold galaxies, Carnegie needed a high-powered system with the capacity to display these sets with ease. This system enables Carnegie scientists to experience their stellar research, and allows detailed analysis of spatial relationships from new perspectives.
The Solution
 Working closely with Dr. Ana Bonaca and Dr. Andrew Benson, the team concluded that there is an opportunity to expand data visualization capabilities, leading to increased utilization and more efficient processes for scientists running the system.
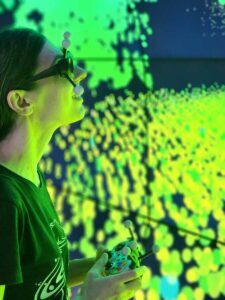
Chris Scharver, Mechdyne Senior Software Solutions Architect, participated in an onsite event at the VizLab, giving him first-hand experience of an end-user interacting with the system. From that event, Chris developed custom software to automated the data-loading process, allowing scientists to “plug and play” with the data sets within the system. The VizLab will continue to use the display technology familiar to them, like the controller to navigate, and glasses to experience data in 3D, but he streamlined the content-loading process.
The experimentation and integration of new interaction tools, with existing research processes, is vital to nurture the innovation of the digital research space; It enables dynamic collaborative tools to streamline research processes, and the communication of that research to academic communities and beyond.
 The Carnegie VizLab studies stellar streams using observational stellar graphic data of stars. Particular stars in these stellar streams are plotted to analyze the path and change in composition. Traditionally, these points are plotted two-dimensionally on multiple graphs, but using visualization software, the data can be plotted three-dimensionally. Bringing data into getReal3d, visualization provides additional context, different perspectives and depth, and segments and planes can be turned on and off for additional variable breakdowns. The getReal3d for Unity software enables the analysis of stellar groupings in relation to each other with ease.
We delivered an on-site session to introduce the upgrades for the research team, future-proofing training plans, developing student employees, digging into Unity software’s additional capabilities, and concluding with handing-off the source code and additional automations so the VizLab can drive and evolve the system to suit their data themselves. Understanding the use cases, the story of the science and background, helped our engineers customize Carnegie’s system and the training to meet specific goals, and create clear guides in how to upload data, to hit the ground running.
Focused on ROIs
Through our additional support, Mechdyne’s focus is on how we can guide the end user to get the very best return on their investment in a large-scale visualization system, asking the hard questions, observing use cases in action, and thinking critically is all part of our process to ensure that systems bring value to an organization to make the biggest impact. We bring visualization to the heart of the research, decision making, and engagement activities. The VizLab team gets to focus on the science and data, and the Mechdyne team gets to enable discovery for another partner.
Building productive long-term relationships with clients, and maintaining focus on their desired return on investment in visualization infrastructure and professional software development remain key priorities, and form a substantial part of why our partners continue to choose Mechdyne.
If this case study resonates with your visualization goals or systems, the Mechdyne team can conduct custom workshops for your organization on how to get the most out of your visualization system, and/or deliver custom software development to suit different use cases, such as end-user experience, or simply creating a quick-start guide, contact us to get the Mechdyne Software Solutions Team involved in your visualization journey today.
